⭐WeatherMapping - Variable Selection (Station Mapping Tab)
The Station Mapping tab is where raw weather data becomes visual intelligence: turning daily observations from thousands of stations into clear, spatially consistent maps. At the heart of this system lies the Variable Selector, which defines what you’re mapping. Each variable represents a specific physical quantity or derived measure of the atmosphere, surface, or soil, organized into intuitive categories.
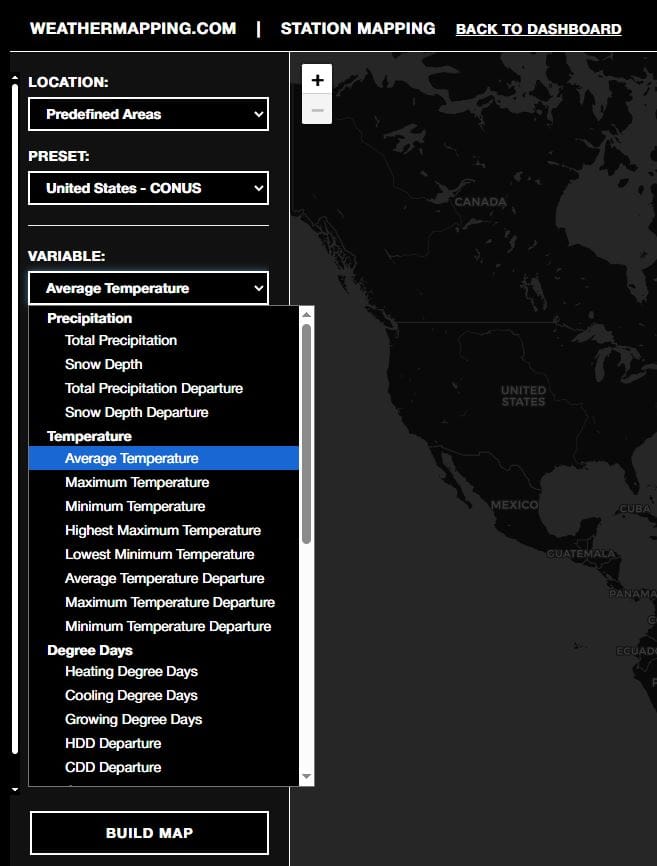
🌧️ Precipitation
Precipitation drives nearly every aspect of weather, agriculture, and hydrology, and WeatherMapping gives you multiple ways to measure it:
- Total Precipitation: The sum of all rain and snowmelt equivalent over the selected period. A key variable for tracking moisture availability and hydrological balance.
- Snow Depth: The actual depth of accumulated snow on the ground, vital for water resource management and seasonal forecasts.
- Total Precipitation Departure: The difference between observed precipitation and the long-term 30-year average, highlighting wet or dry anomalies.
- Snow Depth Departure: The deviation from normal snowpack conditions, helping identify surplus or deficit years.
Together, these variables offer a clear picture of water input, storage, and climatic deviations; essential for drought monitoring, flood forecasting, and agricultural planning.
🌡️ Temperature
Temperature defines the character of any weather regime. WeatherMapping offers several perspectives on it:
- Average Temperature: The daily mean between the maximum and minimum values, capturing overall thermal balance.
- Maximum & Minimum Temperature: Extremes that define the warmest and coldest points of each period.
- Highest Maximum / Lowest Minimum Temperature: Record-breaking extremes across the dataset window, useful for identifying heatwaves or frost events.
- Temperature Departures: Anomalies from the 30-year climatological average, showing whether conditions were unusually warm or cold.
Temperature variables form the foundation for countless analyses, from urban heat risk to yield modeling and climate change assessment.
🌾 Degree Days
Degree days convert temperature into something more functional, the amount of warmth or coolness relative to a base threshold.
- Heating Degree Days (HDD): Quantify how much (and how long) temperatures fall below a comfort threshold, indicating heating demand.
- Cooling Degree Days (CDD): Measure warmth above that threshold, reflecting cooling demand.
- Growing Degree Days (GDD): Track cumulative warmth available for plant growth and development.
Each of these has a corresponding departure variable that compares conditions to long-term norms, making it easier to spot unusually mild winters, extended growing seasons, or excessive summer heat.
🌬️ Wind
Wind data reveals atmospheric energy and movement, crucial for understanding storms, energy production, and surface stress.
- Wind Speed: The mean sustained speed over time, used in climatology, aviation, and energy modeling.
- Maximum Gust Speed: The strongest recorded wind burst, important for extreme event tracking.
- Wind Speed Departure / Gust Departure: Indicators of whether current wind conditions deviate from long-term averages, hinting at calmer or stormier patterns.
Wind variables not only capture local dynamics but also feed broader analyses like renewable energy forecasting and risk mapping.
☁️ Pressure & Clouds
Atmospheric pressure and cloud cover explain the why behind many weather patterns:
- Surface Pressure: The local air pressure at ground level, reflecting broader synoptic systems (highs, lows, and fronts).
- Cloud Cover: The fraction of sky obscured by clouds, impacting solar radiation, surface temperature, and evapotranspiration.
- Departures: Anomaly versions reveal persistent blocking highs, unusual overcast periods, or deviations in seasonal circulation patterns.
This category is particularly useful for researchers studying storm development, energy balance, or global circulation changes.
☀️ Radiation & Evaporation
WeatherMapping integrates the surface energy balance, the invisible link between sunlight, evaporation, and climate response.
- Surface Solar Radiation: The total incoming solar energy reaching the ground, critical for solar power, crop photosynthesis, and temperature modeling.
- Evaporation: The amount of water vapor transferred from surface to atmosphere, key to hydrology and drought diagnostics.
- Departure Versions: Track deviations from normal radiative or evaporative conditions, pinpointing dry spells, cloud anomalies, or surface heating events.
These are the variables that connect the “visible” weather we feel to the physical processes driving it.
🌱 Soil Conditions
Weather doesn’t stop at the surface. Soil variables capture subsurface interactions where climate, vegetation, and hydrology meet:
- Surface Soil Water Volume: Measures the relative moisture content in the top soil layer, indicating drought stress or saturation.
- Surface Soil Temperature: Reflects near-ground heat dynamics that affect germination, root development, and frost risk.
- Departure Variables: Show how current soil conditions differ from their long-term climatology: a key diagnostic for assessing agricultural stress or hydrological anomalies.
Soil data gives context to everything above it: precipitation, temperature, and vegetation all depend on how the ground responds.
The Station Mapping tab isn’t just a visualization tool: it’s a full-spectrum weather analysis engine. From rain to radiation, temperature to soil, each variable adds another layer of meaning to the map beneath it, turning complex data into actionable weather intelligence.