🌡️WeatherMapping - v1.28 Update: SPI, SPEI, Stability Improvements, and What’s Next
WeatherMapping.com v1.28 is now live, bringing a number of useful additions, fixes, and quality improvements across the platform.
This update focuses on expanding analytical capability, improving usability inside Station Mapping, refining regional presets, and tightening up platform stability for all users.
What’s new in v1.28
Standardized Precipitation Index (SPI) and Standardized Precipitation Evapotranspiration Index (SPEI) added
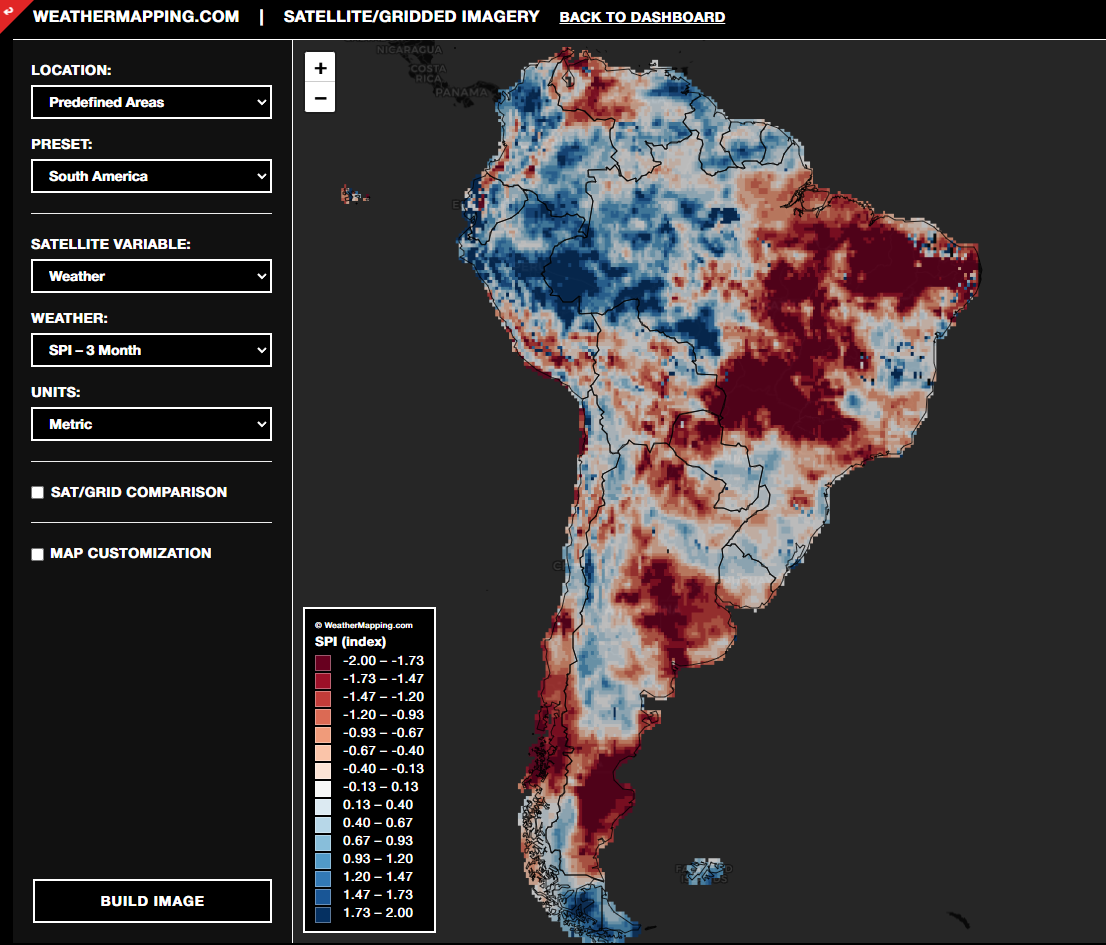
We have added both Standardized Precipitation Index (SPI) and Standardized Precipitation Evapotranspiration Index (SPEI) to the Gridded Data / Satellite Imagery module.
These additions give users stronger drought and moisture-monitoring capability directly inside the platform. SPI helps highlight precipitation anomalies over time, while SPEI adds the evaporative demand component, giving a more complete picture of dryness and moisture stress.
SPI is pictured below.
Station Mapping variable selector issue resolved
We have fixed an issue in the Station Mapping module where variable selection behavior could be disrupted when modifying or changing date inputs.
Your selected variable will now remain in place when switching forecast providers, creating a smoother workflow and removing the need to repeatedly reselect the same field.
Expanded preset regions and improved system control breaks
We have expanded our preset regions to include more groupings and specified areas relevant to commodities.
We have also adjusted a number of system control color breaks and bin values so they are more representative and more useful in practice. This should improve visual interpretation and make outputs more aligned with what users actually need to analyze.
Minor fixes and broader stability improvements
This release also includes a series of smaller bug fixes and platform stability improvements.
A lot of this work has been focused on improving reliability for Gateway customers and keyless entry workflows, along with general cleanup across the application.
Coming soon
We are already working on the next round of improvements.
Editable notes in AutoReports
We are adding an editable notes section within AutoReports to better support custom area mapping and point-based graphing.
We are also working on functionality to let users port their AutoReport values directly into the Mapping, Satellite, and Graphing modules, making it easier to continue analyzing retained values elsewhere in the app.
More Station Mapping variables
The Station Mapping module will soon support additional variables, including:
- Snowfall
- Mean Sea Level Pressure
- Relative Humidity
This will broaden station-level analysis and make the module much more flexible for day-to-day operational use.
7-month daily forecast support in API / Graphing
Our API / Graphing section will soon support our daily updating 7-month daily forecast for selected variables.
This is a significant expansion for users who need longer-range planning and direct integration into their own systems. If you are interested in setting up a direct data feed or need help with API services, contact us for details.
Final note
v1.28 is another step toward making WeatherMapping more useful, more stable, and more operationally valuable for serious users.
More improvements are already on the way.