⚖️WeatherMapping - The Yearly Comparison Tool
Weather is Always Judged in Context
Weather is always judged in context. A wet week means nothing unless you know how it compares to last year. A heatwave only matters when you can measure whether it is hotter than the same stretch in previous seasons. The problem is that traditional weather platforms make that comparison difficult, bouncing between charts, remembering numbers, and eyeballing differences.
WeatherMapping.com's Yearly Comparison Tool fixes that problem directly.
This tool lets you select any date range, the last 3 days, the last 7 days, the last 30 days, or a custom window, and instantly compare those days against the exact same calendar period from another year. It does not approximate. It does not smooth. It does not guess. It pulls the raw daily values from both periods and returns a clean difference map, making it impossible to misinterpret the signal.
In a world where small changes in temperature or precipitation can mean big impacts for agriculture, energy demand, commodities, and consumer behavior, this kind of precise comparison is extremely valuable.
Let’s break down exactly what the tool does, how it works behind the scenes, and how to interpret the results.
What the Tool Actually Does
The logic is straightforward, but extremely powerful.
You choose a location.
Any location, preset area, country, or custom drawn region.
You pick a weather variable.
Temperature, precipitation, snow depth, wind speed, solar radiation, humidity, anything the platform supports.
You select a date range.
For example:
- Last 7 days
- Last 14 days
- June 1 to June 10
- A custom window
You choose a comparison year.
For example:
- 2024
- 2012
- 2000
The tool extracts both periods and computes the differences.
For each grid point in the selected area, the tool calculates:
difference = current_year_value minus comparison_year_value
The results are returned as a geospatial map.
Every pixel on the map shows the departure for that exact location. Positive or negative values tell the story immediately.
This design removes all the noise. Instead of bouncing between years or doing mental arithmetic, you get a clean difference map across the entire region.
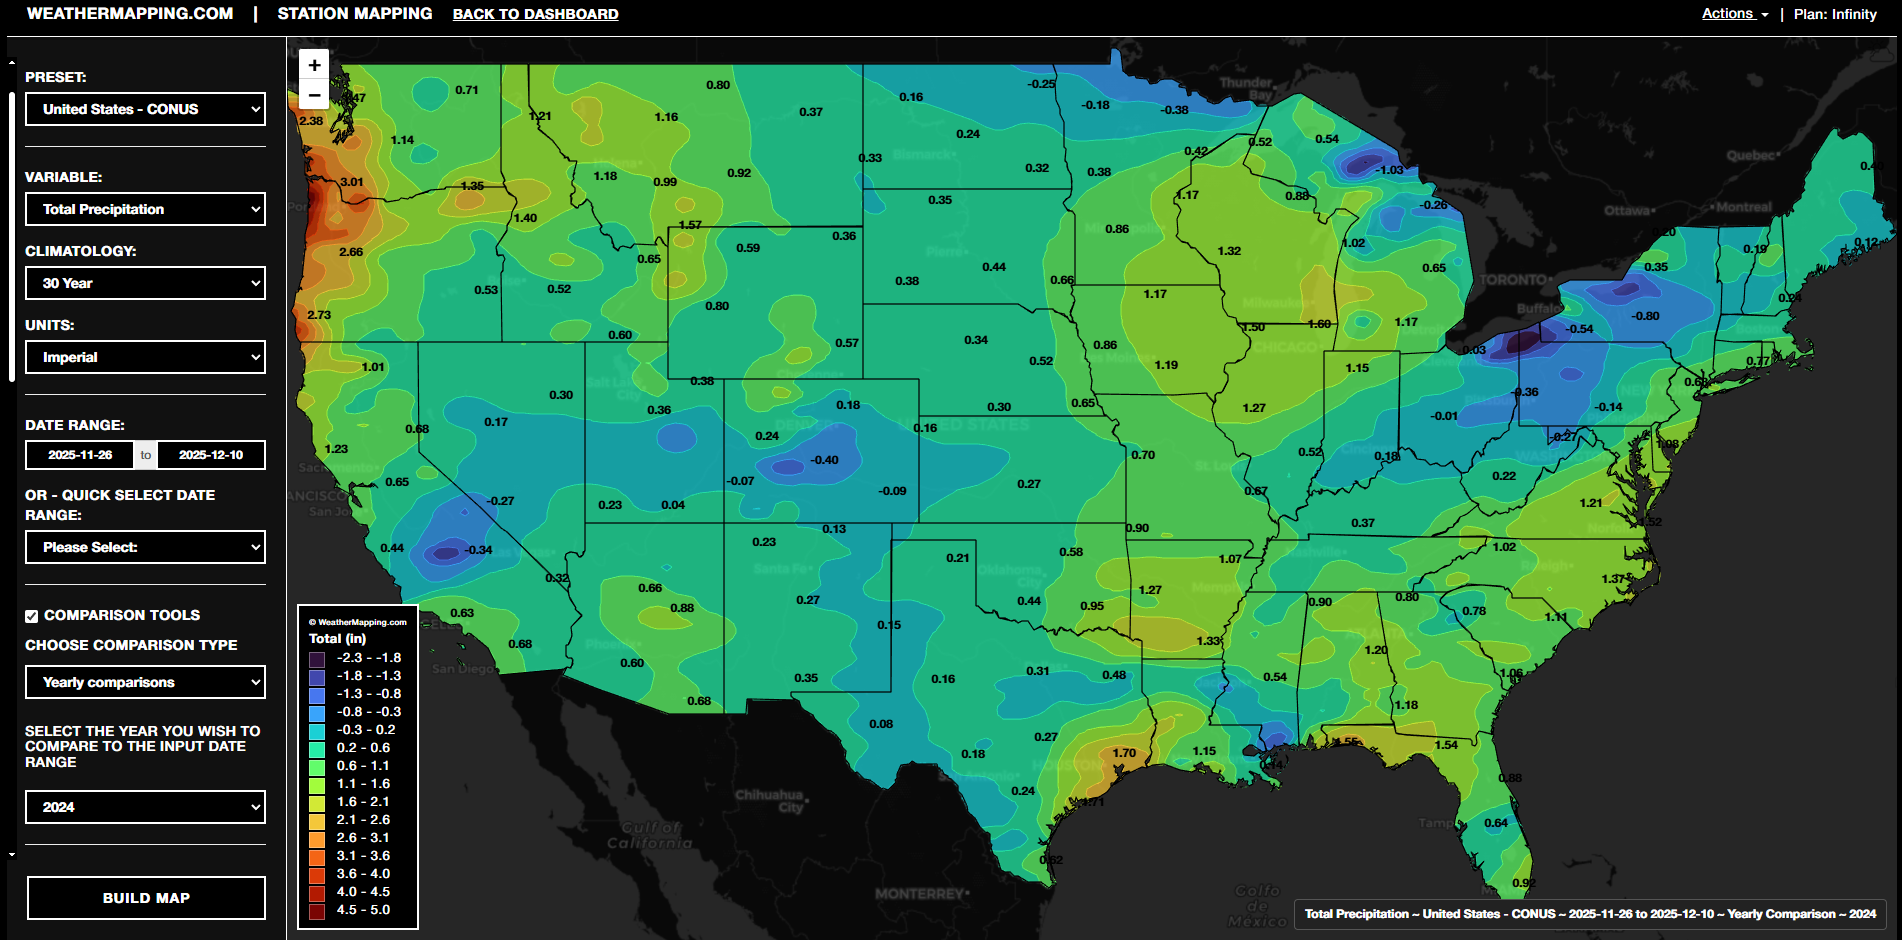
A Clear Example: Total Precipitation
Imagine today is May 10, 2025.
You select:
- Variable: Total Precipitation
- Date range: Last 7 days
- Comparison year: 2024
Here is what the system does behind the scenes:
- Pulls May 3 to May 9 for 2025
- Pulls May 3 to May 9 for 2024
- Computes the difference for every map pixel:
Difference (mm) = Total Precipitation 2025 minus Total Precipitation 2024
The output is a difference map that highlights the exact areas that were wetter or drier than the same week in 2024.
How to read the map
- Positive numbers mean 2025 was wetter than 2024
- Negative numbers mean 2025 was drier
- Zero means both years had the same precipitation for that location
For temperature variables, the interpretation is identical:
Positive means warmer, negative means cooler.
The power of this system is that you do not have to compare two full maps side by side. You get a single, clean difference map that shows the departure directly.
Why This Matters
Agriculture
Farmers, agronomists, and analysts care about deviations from last year. The same rainfall in early June can mean something completely different if last year was extremely dry or extremely wet. A precipitation departure map tells them exactly where conditions are improving or deteriorating.
Energy
Temperature departures drive actual load. A 4 degree departure compared to last year can translate directly into higher cooling demand. Energy analysts need differences, not isolated temperatures.
Retail and Consumer
Retailers depend heavily on year over year weather differences. A warmer early spring compared to last year affects apparel sales, beverage demand, and store foot traffic. WeatherMapping gives them the same metric that internal forecasting teams spend days calculating.
Commodity Trading
Weather departures often move markets. Natural gas, wheat, corn, soybeans, soft commodities, livestock, and even metals can react to hotter, colder, wetter, or drier conditions. Traders need a clear signal that shows how this year is tracking relative to the last.
WeatherMapping’s Yearly Comparison Tool provides that in one map.
Final Thoughts
The Yearly Comparison Tool is one of the simplest and most powerful features inside WeatherMapping. By comparing any recent period to the same stretch in any previous year, and presenting it as a clean difference map, it gives users a fast and objective way to understand how conditions are shifting.
Whether you are tracking rainfall ahead of planting, monitoring temperature anomalies for energy demand, or evaluating dryness against last year for commodity markets, this tool delivers immediate clarity.