📃WeatherMapping - Public Daily US Weather Maps

A Public Preview of WeatherMapping’s Daily U.S. Weather Maps
We’ve published a public preview of WeatherMapping’s daily U.S. (CONUS) weather analysis, showcasing a small subset of the mapping capabilities that power the WeatherMapping platform.
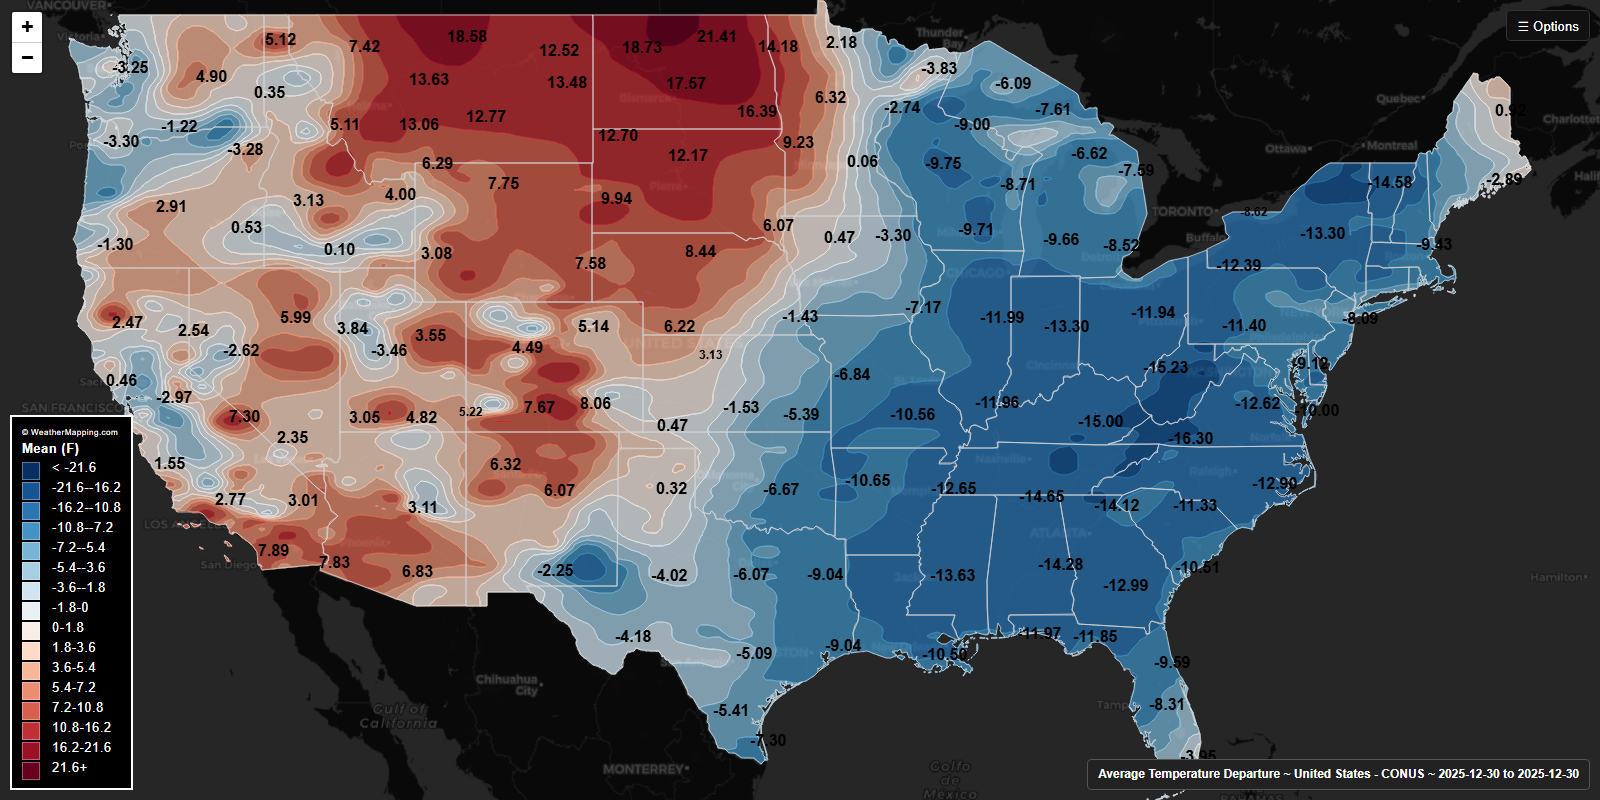
This page presents a fixed, daily-updated snapshot of key national weather signals, including temperature departures, precipitation, soil moisture, degree days, and recent extremes. Each map is generated from a consistent dataset and refreshed daily as part of our normal production workflows.
These are not mock-ups or static graphics. The maps you see are built using the same mapping framework and automation engine that runs inside WeatherMapping. What’s publicly available here is a read-only preview of the system in action, designed to give a transparent look at how we structure, process, and visualize weather data at scale.
On desktop and tablet devices, the maps are fully interactive, allowing users to pan and zoom for additional spatial context. On mobile devices, the maps are displayed as static snapshots to preserve clarity and framing within smaller viewports.
This preview is intentionally limited in scope. The full WeatherMapping platform supports dozens of weather and climate variables, global coverage, custom regions, precise location analysis, historical comparisons, forecasts, and data export tools. Those features are not exposed here, but this page reflects the same underlying approach to data consistency, automation, and presentation.
We’re publishing this preview ahead of a broader platform release to provide a clear, tangible example of how WeatherMapping operates day to day. As development continues, additional public previews and tools may follow.
You can explore the daily U.S. weather maps here:
More to come.